WATER REDUCTION STRATEGY AND PERFORMANCE
Effective water management is critical to our operations, which are water-intensive and reliant on a stable supply. We take a holistic approach to enhance the efficiency, resilience and value of our assets through sound water management practices, ensuring reliable supply and cost savings for homeowners and tenants. Within our managed buildings, the Company draws both potable and NEWater (for non-potable use) from PUB’s utility network, for building operations and maintenance activities. For commercial buildings, water is utilised for cooling towers, toilets, pantries, water features, irrigation and washing activities. At our construction sites, potable water is used mostly by our contractors for sanitation purposes.

| Note: | |
| • | All potable water withdrawal comes from a single third-party water source supplied by PUB. The breakdown of water sources is based on PUB’s Our Water, Our Future report. |
| • | Based on PUB’s Our Water, Our Future report, all potable water and NEWater are categorised as freshwater with Total Dissolved Solids levels of ≤1,000 mg/L. |
| • | In accordance with the Singapore Ministry of Sustainability and the Environment’s update on 8 October 2025, Singapore is amongst the most water-stressed countries in the world due to the lack of natural water resources such as large rivers, natural springs or glaciers, as well as limited land to collect and store rainwater. |
Water Reduction Initiatives
The Company monitors water consumption monthly and annually to detect any anomalies in water usage that may require attention and identify buildings that could be heavy water consumers. To reduce reliance on potable water, the Company uses NEWater from Singapore for our operations, where possible.
To date, 100% of the Company’s managed buildings have been certified as “Water-Efficient Buildings” by PUB for outstanding water conservation efforts. Recognising that water conservation is a shared responsibility, the Company engages our tenants and homebuyers through initiatives such as our Green Lease Partnership Programme and Green Living Guide. These initiatives promote good water conservation practices that complement the Company’s water-efficient design and features in our buildings.
Water Efficiency And Reduction Performance
Holistic water management enhances the long-term value of our assets and developments. As such, we have continuously implemented water conservation initiatives and tracked our water performance since 2007. The Company achieved the 2025 CDP A List in water security, marking the seventh year of this recognition and an affirmation of our robust water management strategy. To maintain this strong track record, we regularly review the water management plans for all our properties and introduce initiatives where areas for improvement are identified.
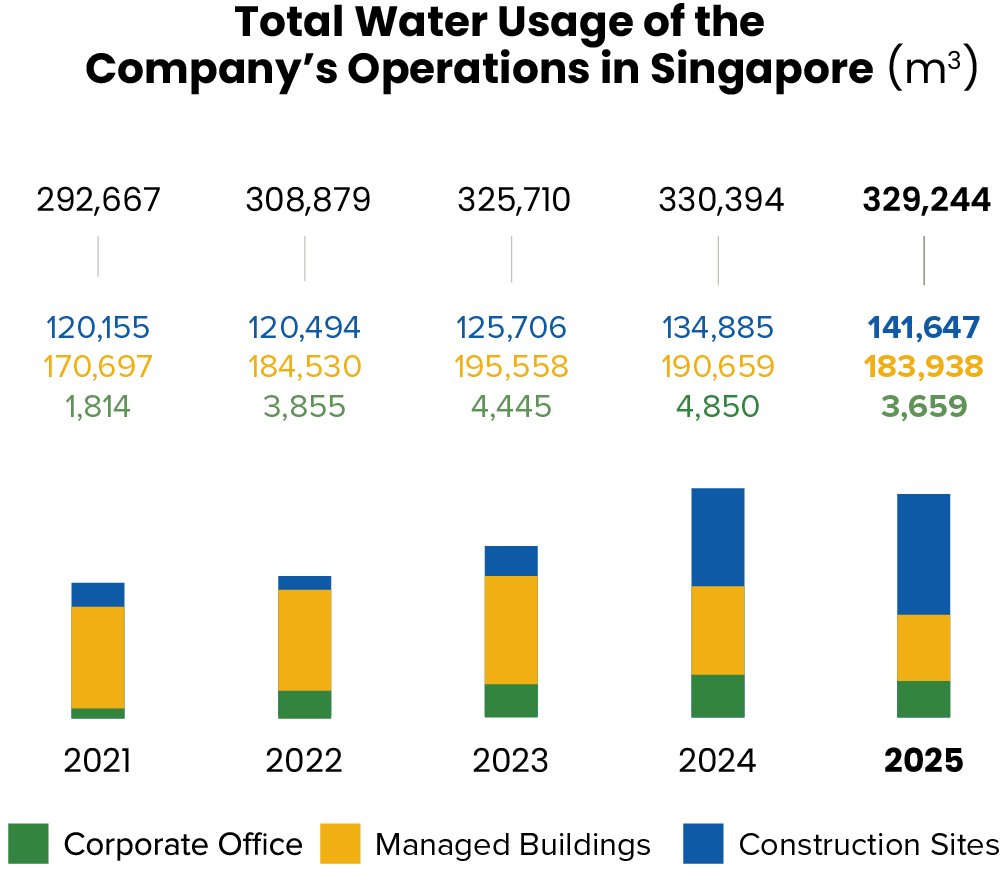
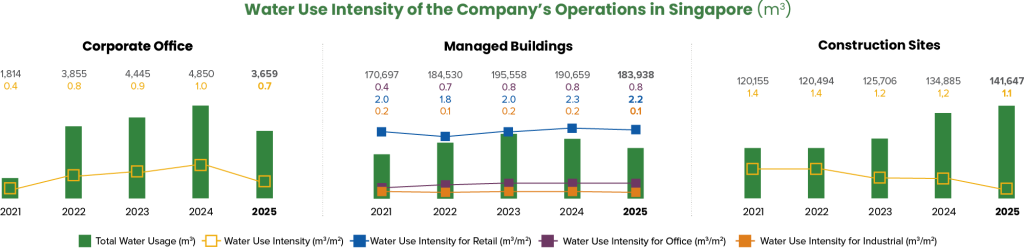
Water intensity for our corporate office and construction sites saw a slight decrease in 2025, due to the increase in floor area under construction. We continue to actively work towards optimising water use. For our managed buildings, we are encouraged to report a modest reduction in water use intensity compared to 2024, demonstrating our ongoing commitment to improving water efficiency.
| Note: | |
| • | Water used and water use intensity are for potable water only. Industrial grade NEWater usage is not included in the amount of water used. |
| • | Total amount of water withdrawn is the same as total amount of water discharged into third-party water (i.e. PUB sewers) with negligible amounts of water consumed. Hence, the total amount of water used is reported here. |
| Note: | |
| • | Managed Buildings Water used refers to potable water only. Industrial grade NEWater is not included in the amount of water used. |
| • | Construction Sites Water use intensity for on-site dormitories is not included. |
| Note: | |
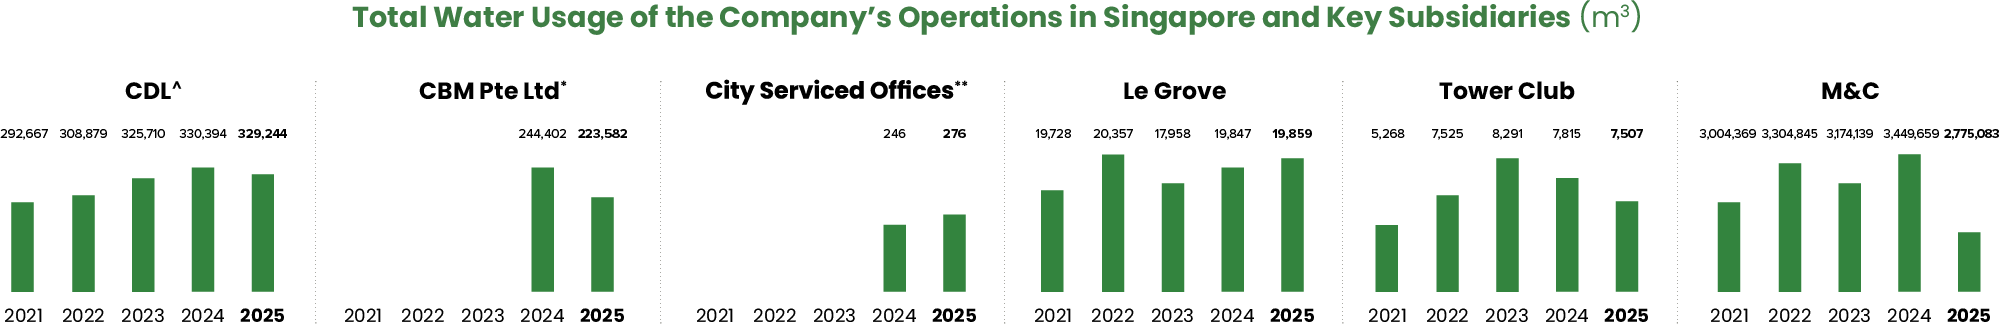
| ^ | CDL refers to our operations that cover corporate office, managed buildings and construction sites in Singapore. |
| * | CBM Pte. Ltd. data has been included from 2024 onwards to report on its fully owned Systematic Laundry & Healthcare Services Pte. Ltd. (SLHS) and CBM’s corporate office’s water use. |
| ** | City Serviced Offices’ water data has been included for 2024 onwards as meters have been installed to track water usage within their facilities. |